Invocation History
Inspect past scenario runs to troubleshoot issues and confirm expected behavior.
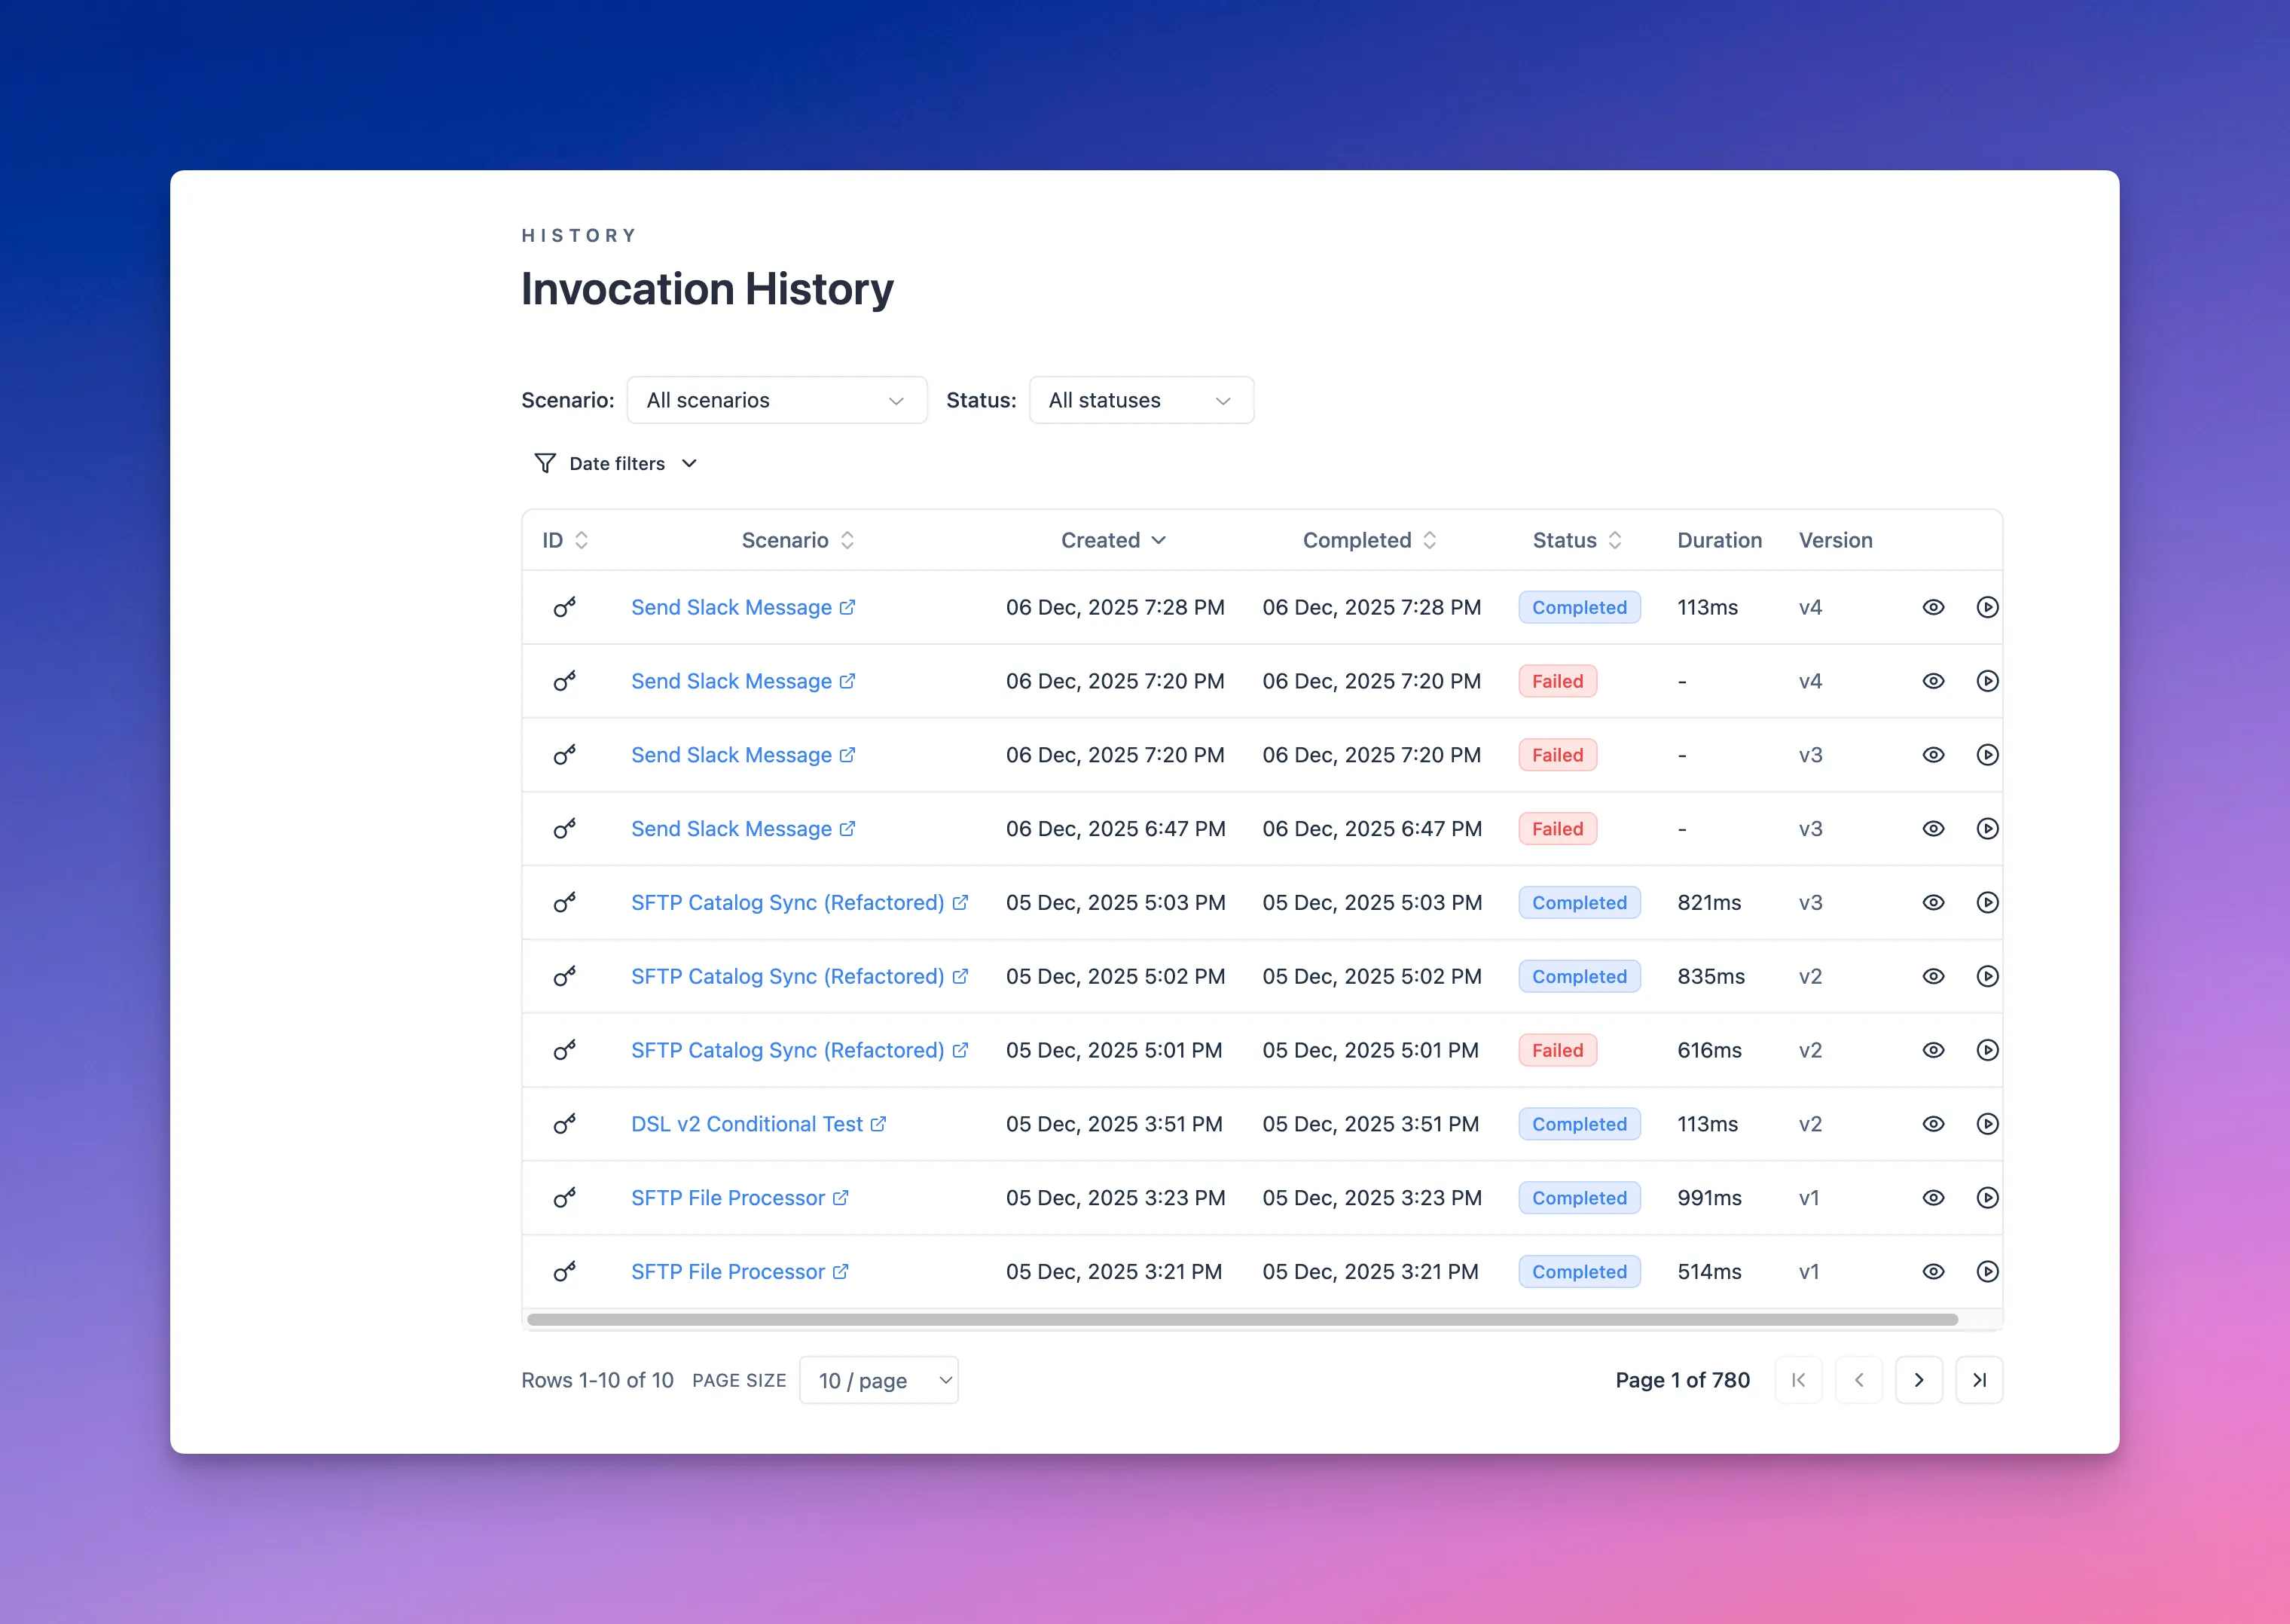
Invocation history shows every top-level scenario execution with timestamps, statuses, and payload details. Use it to trace data through your flow, debug failures, and prove that automations ran when expected. Scenarios invoked from other scenarios are embedded inside the caller and do not appear as separate entries.
What you’ll find
- Run status, duration, and trigger source (manual, scheduled, webhook, or chained call).
- Input payloads and mapped variables at each step.
- Outputs returned to callers or downstream systems.
- Errors, retries, and any logged messages from steps that expose diagnostics.
Typical workflows
- Validate a new scenario by comparing sample inputs to outputs before going live.
- Investigate a failed order sync by drilling into the exact step and payload that errored.
- Confirm SLAs by filtering runs within a timeframe and checking duration trends.
- Export or reference run IDs when discussing incidents with your team.
Filtering and sorting
Narrow down the invocation list using filters to focus on what matters most for your investigation.
Filter options:
- Scenario: Filter to a specific scenario or view all scenarios together.
- Status: Show only completed runs, failures, or in-progress executions.
- Date range: Focus on recent activity or review historical runs from a specific period.
Sort by execution time (newest or oldest first) to track recent changes or trace back to an earlier run.
Combine filters and sorting to build targeted views (e.g., all failed runs from the last 24 hours). When you find the run you care about, click its scenario name to jump straight into the execution graph and inspect the full flow.
Working with scenario invocation details
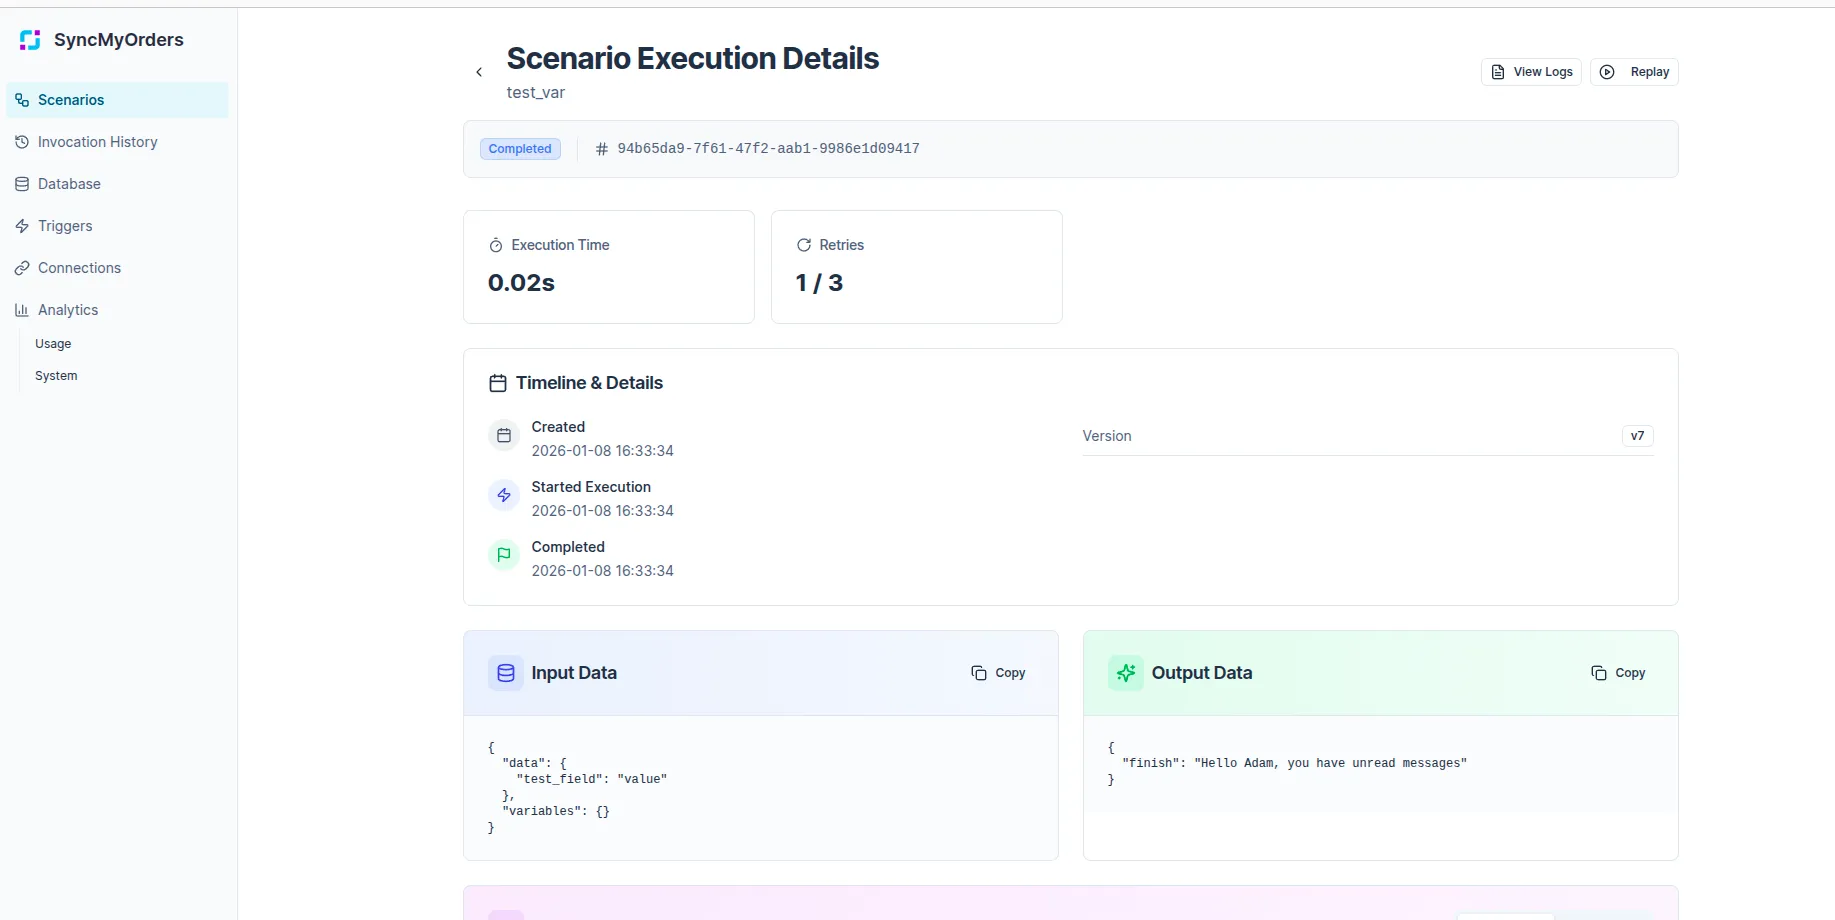
Click on the eye icon for the invocation in the history list to open its detailed view. This shows the complete execution trace from start to finish, including timestamps, retries, the exact scenario version, and the input/output data used.
What you’ll see:
- Execution overview: Start time, end time, total duration, status, and the scenario version that ran.
- Input data: The complete payload that triggered this invocation, formatted as JSON for easy inspection.
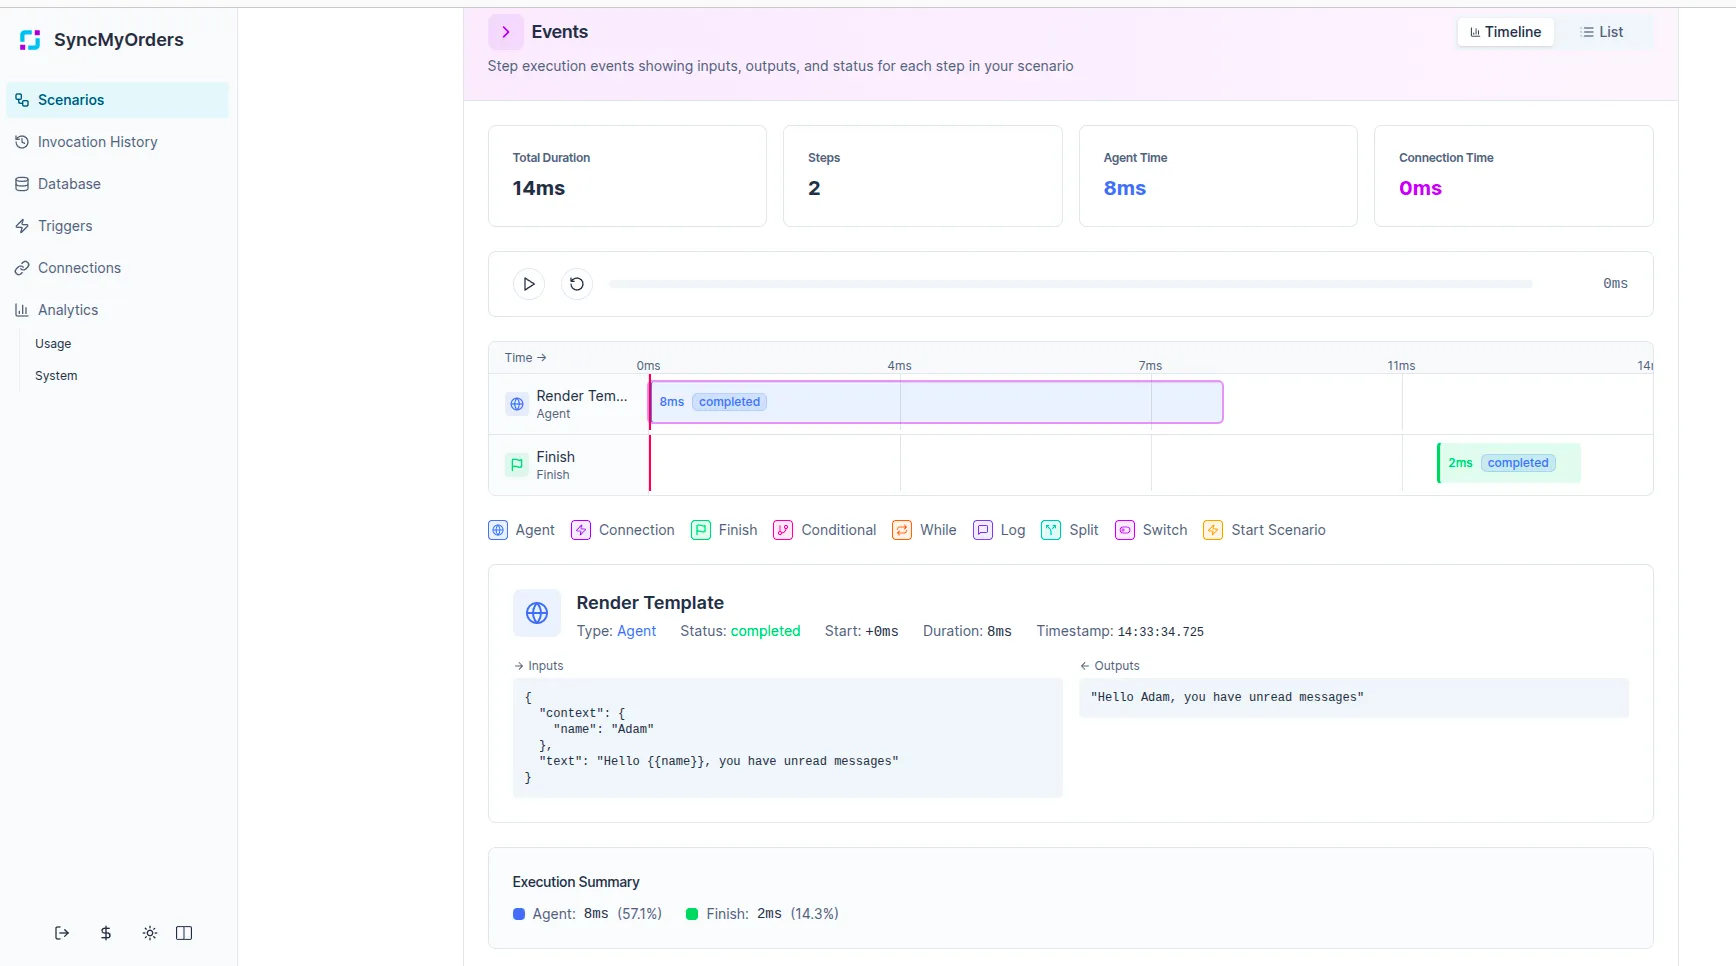
- Step-by-step execution (debug mode): Each step in the workflow with its inputs, outputs, and execution status. Expand steps to see the exact data transformed at each stage.
- Output data: The final payload returned by the scenario, ready to copy or compare against expected results.
- Nested scenarios: If the scenario called other scenarios, those executions appear inline within the parent run.
- Errors and warnings: Any failures are highlighted with error messages, stack traces, and the exact step where execution stopped.
Actions available:
- Replay: Rerun the scenario with the same input data to test fixes or reproduce issues.
- Copy run ID: Share the invocation ID with your team or use it in API calls.
Use the details view to understand exactly why a run succeeded or failed, verify data transformations between steps, and build confidence in your scenario logic by comparing inputs to outputs.
Data retention and auto-cleanup
Invocation data is automatically cleaned up after a few days (typically 48–72 hours), so plan investigations accordingly if you need to keep records longer.
Next steps
- Pair history with alerts so you’re notified on repeated failures.
- Keep sample payloads handy for common issues to speed up replays and fixes.